Time-stamping Output and Profiling
Time-stamping
Sometimes you need to get the time stamps for each line printed by a programm.
How to do it? Fortuntely there is a tool called ts (like Time Stamp).
In openSUSE it is not installed by default, but is available in the standard repositories in the moreutils package:
sudo zypper in moreutils
When using time-stamping it is a good idea to get rid of buffering which might prevent from getting the correct time. So the usual usage pattern should be something like this:
unbuffer <command> | ts
See man ts for more details, it has few but very usefull options. It can display
absolute or relative time, define the precision, etc…
Profiling
If you can get exact time stamps for each output line then it is easy to find the line which took too long time.
In this example I was writing a new test for the s390 YaST module. I noticed that one test
took much more time than the others. So I used ts to get the real numbers,
the full command in this case was unbuffer rake test:unit | ts -i %.s:
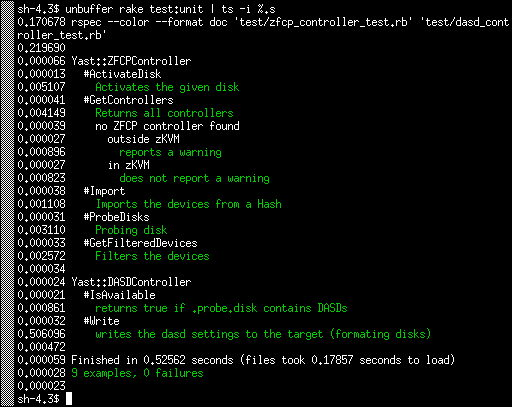
As you can see the tests usually take just few miliseconds, 5 ms at most. Except the Write test which takes more than 500ms. I was wondering why.
Debugging
So how to find the place where the test took most of the time? You could use the Ruby profiler:
ruby -rprofile -S rspec <test_file>
But I found the output too detailed without finding any relevant information, probably because it measures the CPU time, not the real time…
The alternative approach is simply to add the puts call somewhere in the tested
code. So you can measure how long it takes to reach this specific point.
Using the usual bisect approach you can find the problematic place quite quickly.
In this case the problematic place was surprisingly calling the sleep(500)
function here
which obviously adds 500ms to the test time. The fix was easy, simply
mock the sleep call in the test and return immediately.
The result is that the Write test now also takes few miliseconds just like the others:
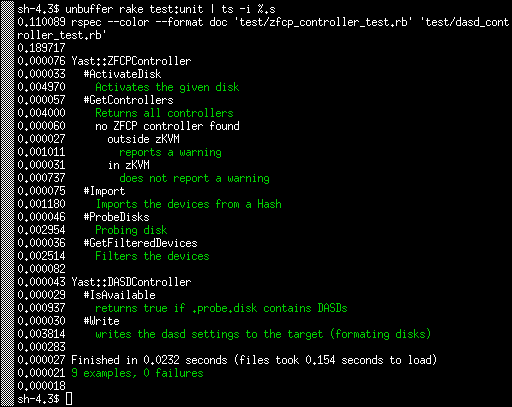
The test as a whole is now more than 20x faster. ![]()
Conclusion
In this case the real improvement was small, saving half a second is not a game changing feature.
But I used this approach in the past in the YaST registration module where the problem was caused by running a SLP network discovery without mocking it. That took much more time and scanning the local network in tests is at least not nice.